


The Cell is a Bag of Molecules
Some notes on diffusion.

A cell is a vibrating ball of energy — a chaotic sack of molecules. These molecules float around and collide with one another constantly. Every protein in a cell, for instance, collides with about 10 billion water molecules each second.
Cells “work” despite this chaos. Most events within a cell only happen if the right things collide at the right time, and at sufficient frequencies. A DNA polymerase enzyme, for example, can only copy a genome if it first collides with the right part of DNA. If a transcription factor is present only in small quantities, then it will be less likely to turn on its target gene at any given moment in time; the odds of a collision go up as a protein’s abundance goes up.
This randomness is why cells are often called "unreliable" or “messy,” though such descriptors are human-imposed terms that biology doesn’t really care about. Disorder seems to be, rather, a fundamental part of life.
A few weeks ago, I sent out a blog post proposing that someone — I didn’t really care who — should go out and build a website similar to Our World in Data, but for biotechnology. The goal would be to collect interesting datasets about biology, DNA sequencing, and so on, and then share them as charts to help readers understand how those technologies work and where progress has stalled.
Our World in Data, But For Biotech

In 2011, while working in Brazil, Max Roser began formulating the idea for Our World in Data. He initially planned to publish “data and research on global change,” possibly as a book. Before long, that modest blueprint morphed into something far more ambitious.
Well, I got about 100 emails in response (which was gratifying) and began building a small team to start collecting some datasets. Soon thereafter, I found a paper, published in 2012, that contains estimates on diffusion rates for every protein in the E. coli proteome. And here, I realized, was a great opportunity to explore the “chaos” of a living cell — visually.
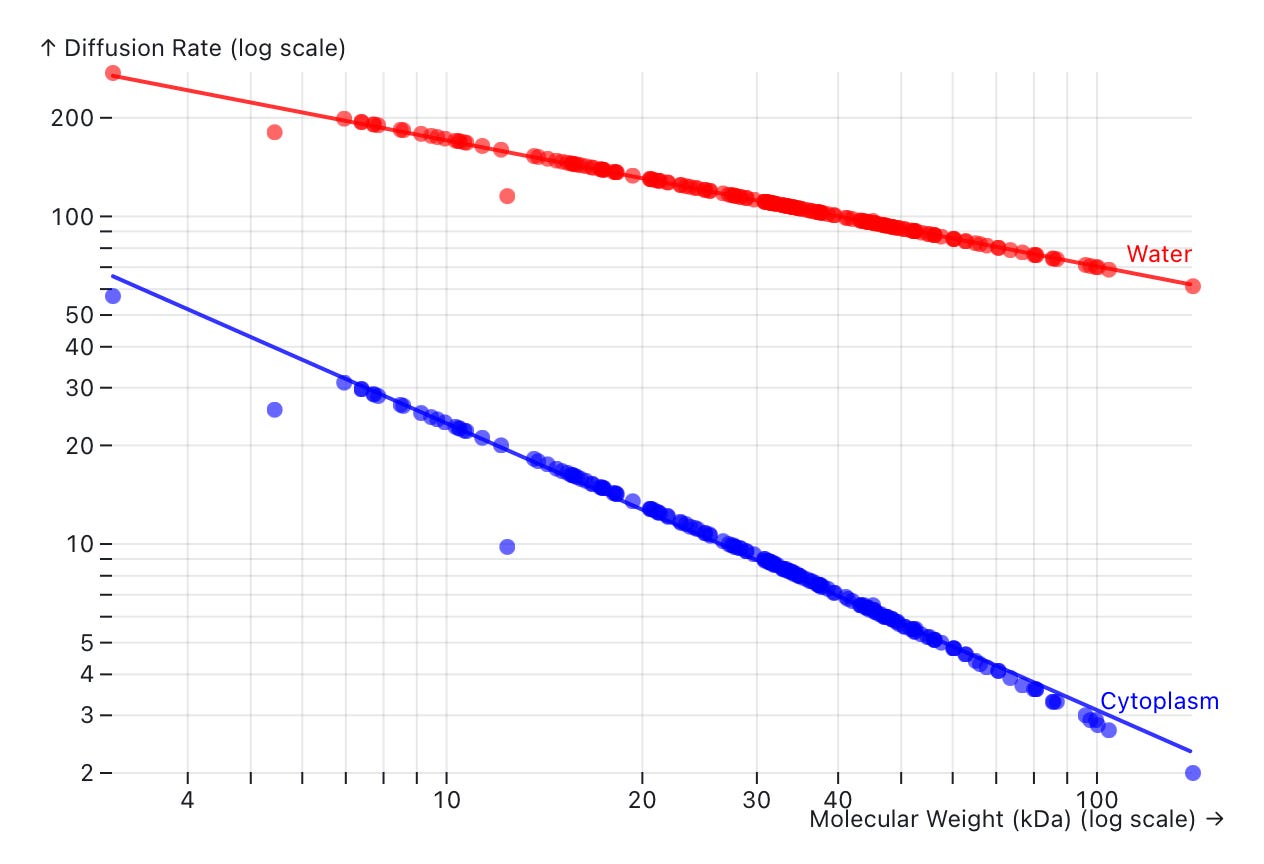
After scraping the data (out of a poorly-formatted PDF, of course), I plotted the estimated diffusion rates for 100 random proteins. Here’s the chart:
Let me explain what’s going on here.
The x-axis of this chart corresponds to the molecular weight of each protein in the dataset, in kilodaltons. The y-axis is the predicted diffusion rate (micrometers squared per second). The same set of proteins are plotted twice in this chart — once for their diffusion rate in water (red line) and once for their diffusion rate in the E. coli cytoplasm (blue line.) The trend that emerges is clear:
As a protein’s molecular weight increases, its diffusion rate tends to go down.
This relationship is linear on a log-log chart!
Diffusion rates are far lower in the crowded cytoplasm of a cell compared to water.
So why is this chart interesting? Because it visually conveys the crowdedness of a single cell. A cell is about 70 percent water by mass, and the other 30 percent — the so-called dry mass — is basically a jostling, chaotic soup of macromolecules, ions, and organelles, all packed together. This crowding creates incessant collisions.
It is for this reason that, in the cytoplasm, a vast majority of proteins only diffuse between 5 and 10 µm2 per second. But if you were to pluck those proteins out of the cell and drop them in water, they’d move more than an order-of-magnitude quicker.
Said a more quantitative way: in E. coli, a typical protein takes just 0.01 seconds to traverse the cell’s diameter. That same protein would take tens of milliseconds to cross a distance of 10 micrometers, around 4 minutes to move 1 millimeter, and over 6 hours to move a distance of just 1 centimeter. The further away a molecule must diffuse, the less likely it is to get there by a “random walk” alone. It is partly for this reason that cells are very tiny — it makes collisions more likely. And that’s how cells “work.”
https://bionumbers.hms.harvard.edu/Search.aspx?task=searchbyrecent
Cheers
One related thing that would help is bringing back the Roche biochemical pathways chart, especially the online version. It has been offline for quite some time for "revisions"; it's a shame Dr. Michal's work is unavailable; it is such a rich resource!