


The Most Abundant Protein
... is probably not what you think it is (in E. coli).

One reason David Goodsell’s paintings attract biologists, I think, is because they are unapologetically realistic. His paintings depict seas of macromolecules splayed out in pastel shades. A Goodsell painting looks nothing like the spacious diagrams one finds in high school biology textbooks, and that’s exactly why they linger in the mind: they show, visually, how crowded cells really are.
But crowded with what, exactly?

Well, an E. coli cell has an internal volume of just one femtoliter (or one cubic micron) and a total mass of 1 picogram. These are handy numbers to remember. About 70 percent of that mass is water, and the other 30 percent is mostly proteins, RNA, DNA, lipids, and smaller molecules like metabolites. Proteins alone make up 55 percent of the cell’s dry mass, which made me wonder: Which protein is the most abundant?
If I sat down at my computer without looking up the answer, I’d guess it has something to do with translation. After all, proteins account for most of the cell’s dry mass, and other proteins are needed to build all those proteins! So maybe the most abundant protein is one of the ribosomal subunits, or something involved in transcribing DNA to RNA. Another possibility is that the most abundant protein is involved in energy production or some other critical process.
But then I started digging. And here’s what I found.
In 1978, researchers believed that elongation factor EF-Tu was the most abundant protein, with around 60,000 copies per cell. EF-Tu helps the ribosome grab the correct amino acid during translation. Around that same time, scientists also identified acyl carrier protein and RpiL (involved in fatty acid biosynthesis and protein translation, respectively) as top contenders. They estimated that each E. coli cell has something like 60,000 to 110,000 copies of these proteins.
Then, in 1979, a paper in Cell argued that those weren’t actually the most abundant proteins. Instead, the authors claimed that E. coli contains a protein with an order-of-magnitude more copies than either EF-Tu or RpiL or anything else. They reported more than 700,000 copies of this protein inside each cell, an astounding figure given that E. coli typically holds only 3–4 million total proteins.
That protein is called Lpp, and it basically maintains the structural integrity of the cell envelope by anchoring the outer membrane to the peptidoglycan layer. Lpp exists in two forms: one-third of the molecules are covalently bound to the peptidoglycan, and the remaining two-thirds float freely in the membrane. Together, these molecules create a network that stabilizes the cell envelope. They’re what keep cells “roughly” spherical and prevent them from collapsing. Without Lpp, the outer membrane would detach from the peptidoglycan layer and cells would get wrecked by various environmental stressors.
Decades of experimental evidence now support the high copy number of Lpp. Way back in 1969, a duo named Braun and Rehn treated E. coli cell walls with trypsin (an enzyme that cleaves proteins) and observed a rapid decrease in light absorbance. This suggested that about 40 percent of the rigid cell wall is protein. Subsequent experiments identified Lpp as that protein.
A follow-up study in 1972 used lysozyme and SDS-PAGE to separate the bound and unbound forms of Lpp. By tracking radiolabeled arginine incorporation,1 the researchers discovered that free Lpp is synthesized first and then converted to the bound form. Combining those findings with earlier data, they estimated that each cell contains around 300,000 total Lpp molecules. Later studies, including the 1979 Cell paper, refined this estimate to 720,000 copies (I don’t entirely understand how; the authors cite those earlier experiments).
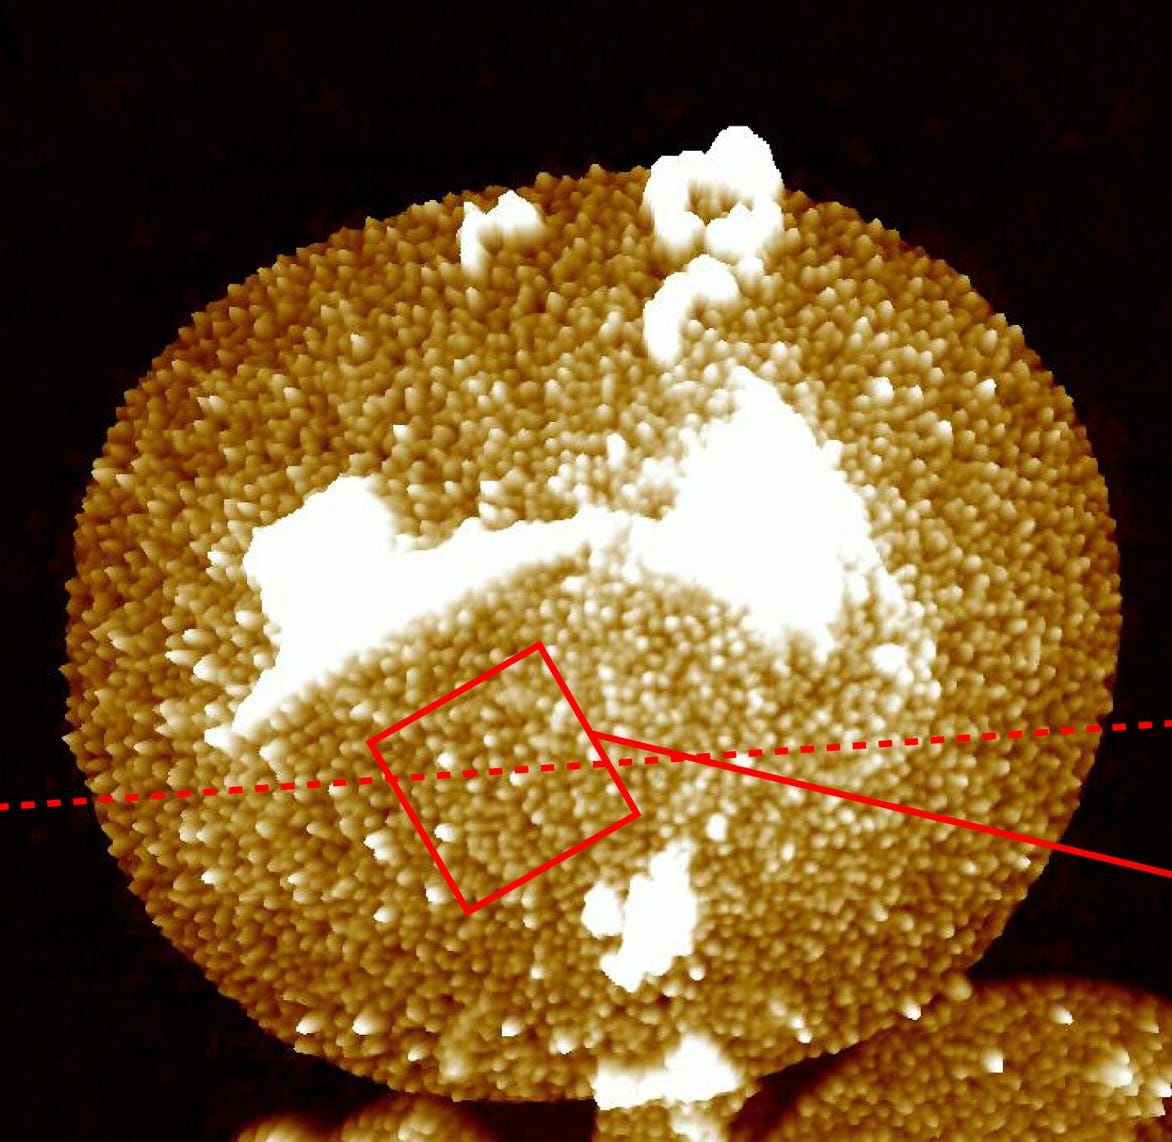
[Despite some of this shaky evidence, I do believe that Lpp is the most abundant protein by far. A 2023 paper in Science Advances visualized this protein in individual cells using atomic force microscopy, and again concluded that each E. coli cell contains hundreds of thousands to about one million copies.]
Despite the evidence for Lpp’s abundance, some discrepancies remain. For example, the PaxDB database, which compiles protein abundance data from various studies, lists UspA (a stress response protein) as the most abundant E. coli protein. That is almost certainly not correct; many studies isolate and measure cytoplasmic proteins but lose the cell membrane in the process, which can bias results. Protein abundance also depends heavily on the E. coli strain and its growth conditions. Rapidly dividing cells ramp up Lpp to expand their membranes—but they also churn out more ribosomes to handle higher translation demands. Conversely, cells in nutrient-limited conditions might boost stress response proteins like UspA.
So what are the lessons in all this? A few things:
Few questions in biology have simple answers, and my initial guesses are often wrong.
Don’t just trust a database. Instead, figure out how its data were actually collected before drawing conclusions.
Cells change a lot from one moment to the next, and also between strains. Answers depend on these variables!
Here’s how it works, briefly: Researchers feed cells a radioactive form of the amino acid, arginine. When the cells make proteins, they incorporate this tagged arginine and scientists can measure it using radioactivity devices. For this particular Lpp experiment, researchers grew E. coli in the presence of radiolabeled arginine and then separated the different forms of Lpp (bound vs. free) on SDS-PAGE gels. By looking at how much radioactivity appeared in each band over time, they could see whenand where new Lpp was being produced.
It does pass the sniff test. In a Nick Lane sense of structure preceding information: you gotta build the cell before you can worry about duplicating it. Nothing guarantees that building takes more protein than copying, of course, but the double thick walls of a sphere are a significant construction.
Thanks for the succinct summary. Very interesting and the lab technique summary was an added bonus.